API Support Metrics Every Developer-Tools Team Should Track
Track API support metrics that reveal response speed, verified resolution, recurring integration friction, documentation gaps, AI quality, and engineering toil.

API Support Metrics Should Measure Outcomes, Not Activity
API support metrics should tell a developer-tools team whether customers are reaching verified technical outcomes with less friction. Too many dashboards stop at ticket volume, first reply time, and an average satisfaction score. Those numbers describe motion, but they cannot show whether the reply used the right endpoint, whether an authentication failure was actually resolved, whether the same integration problem returned, or whether support quietly consumed another afternoon of engineering time.
The measurement challenge matters because API questions cross several systems. A developer may begin in live chat, continue by email, share a sanitized request identifier, and require an operator to compare documentation with runtime evidence. A fast response can still be wrong. A long conversation can be the right result when it prevents an unsafe guess. An escalation can signal healthy judgment rather than failure.
This guide defines a practical set of API support metrics, explains the denominator and failure modes behind each one, and turns them into a 30-day baseline. The objective is not to manufacture a single efficiency number. It is to create evidence that tells support, engineering, documentation, and product leaders what to improve next.
Give Every API Support KPI a Measurement Contract
Write a metric contract before building a dashboard. Name the question the metric answers, the event that starts the clock, the event that stops it, the eligible population, exclusions, time zone, business-hours policy, segmentation fields, owner, review cadence, and action threshold. Without that contract, two teams can report different first response times from the same conversations and both believe they are correct.
Separate indicators, objectives, and promises. Google SRE defines a service level indicator as a quantitative measure of service, an SLO as a target or range for that indicator, and an SLA as a commitment with consequences. The same discipline applies to support. First meaningful response time is an indicator. A target such as 90 percent of urgent production-impact cases receiving a meaningful response within a defined business-hours window is an objective. A contractual response promise is an SLA. Do not use the terms interchangeably.
- Define the eligible conversation and the event timestamps before choosing a target.
- Publish calendar-time and business-hours views when both matter operationally.
- Show p50, p90, sample size, and the share of records missing required timestamps.
- Version the definition so a workflow change does not silently rewrite history.
Metric 1: Demand, Category Mix, and Recurring API Questions
Start with demand, but classify it by the technical fact required to resolve it. Useful categories include authentication, endpoint selection, request validation, rate limits, pagination, webhooks, SDK behavior, environment configuration, account state, incident impact, and documentation discovery. Track arrival volume, unique affected customers, and the share of demand in each category.
Add recurrence. Define a repeated issue as a new conversation from the same customer or a different customer that depends on the same underlying fact within a chosen window. Then calculate repeated conversations divided by all eligible conversations for that fact or product area. A falling recurrence rate after a documentation or product change is stronger evidence than a raw drop in tickets, because overall volume may move with customer growth, seasonality, or a release.
- Demand rate = eligible conversations divided by active integrations, API calls, or another exposure measure appropriate to the product.
- Recurrence rate = repeated conversations for the same technical fact divided by eligible conversations for that fact.
- Concentration = the share of demand represented by the top five technical categories.
Metric 2: First Meaningful Response and Queue Latency
Measure time to first meaningful response, not time to an automatic receipt. The clock begins when an eligible customer request enters the support system. It stops when a person or automation provides a response that advances the investigation: a grounded answer, a focused clarification, a verified status update, or an explicit handoff with the next owner and expectation. A generic greeting or queue acknowledgment should not stop the clock.
Keep queue latency separate from investigation time. Queue latency runs from arrival to ownership. Investigation time begins when work starts and continues until the next evidence-bearing action. This distinction tells a leader whether the problem is staffing and routing or whether operators are spending too long finding API context. Official ticket systems expose separate timestamps and durations for first reply, assignment, requester wait, agent wait, and resolution for the same reason: one duration cannot explain the whole journey.
Metric 3: Time to Verified Resolution, Coverage, and Reopens
Time to verified resolution is the core outcome metric for technical support. Start at the eligible customer request and stop only when the team has evidence that the blocking condition is removed or a clearly defined alternative outcome is complete. Evidence might be a successful sanitized reproduction, a customer confirmation, a stable request identifier tied to the expected result, a corrected configuration, or an accepted product defect with an owner and communicated workaround. Closing a status field without evidence is not verification.
Pair resolution time with reopen rate and verification coverage. Reopen rate is the share of resolved conversations that return to an active state within the defined window. Verification coverage is the share of resolved technical cases with an accepted evidence type recorded. A team that closes faster while reopens rise or verification coverage falls is moving work out of the dashboard, not improving support.
- Time to verified resolution: elapsed eligible time from request to evidence-backed outcome.
- Verification coverage: resolved technical cases with accepted evidence divided by resolved technical cases.
- Reopen rate: resolved conversations reopened within the policy window divided by resolved conversations.
Metric 4: Escalation Quality and Human Handoff Latency
Do not optimize escalation rate downward in isolation. A human handoff is correct when context is insufficient, confidence is low, production risk is high, account-specific authority is required, or a product owner must make a decision. An unsafe answer avoided is a quality win. The useful question is whether the handoff occurred for a documented reason, reached the right owner, carried forward the known facts, and produced a timely next action.
Measure handoff rate by reason and severity, time from handoff to human acknowledgment, reroute rate, and handoff completeness. A complete package can include the customer's objective, affected environment, sanitized identifiers, evidence already checked, source links, attempted steps, uncertainty, risk, and requested owner. Score a sample against a short rubric rather than relying only on the presence of a metadata field.
Metric 5: Grounded Answer Quality for AI and Operators
Answer rate and deflection are incomplete AI support metrics. An automated response counts as useful only if its material claims are supported by current evidence, its citations are relevant and safe, it follows credential and privacy boundaries, and it chooses clarification or handoff when the evidence is insufficient. Measure those behaviors on a reviewed sample and keep the sample stratified across common, ambiguous, adversarial, and high-risk questions.
A practical quality set includes supported-claim rate, citation precision, unsafe-claim rate, correction rate, clarification usefulness, handoff appropriateness, and customer feedback. Add retrieval coverage: the share of evaluated questions for which the required source exists and is retrievable. This separates an answer-generation problem from a documentation or ingestion problem. A low answer rate with correct handoffs can be safer than a high answer rate built on weak context.
Metric 6: Documentation Gap Rate and Source Repair Impact
Support should create a measurable feedback loop for documentation and product quality. Record whether each resolved technical case exposed a source that was missing, stale, ambiguous, hard to retrieve, or contradicted by observed behavior. Documentation gap rate is the share of reviewed resolved cases with at least one confirmed source gap. Time to source repair runs from the confirmed gap to the published and re-indexed correction.
Then measure whether the repair worked. Compare recurrence for the affected technical fact before and after the change using similar exposure and a defined observation window. Review search terms, clarifications, and operator corrections, not just page views. A new page that receives traffic but leaves the same customers confused is content production, not support improvement.
Structured API errors improve this loop. RFC 9457 defines problem details with fields such as type, status, title, detail, and instance; a stable problem type can connect a support category to documentation, while an occurrence identifier can help investigate one event. W3C Trace Context standardizes request context propagation across services, and OpenTelemetry distinguishes traces, metrics, logs, and contextual signals. These standards do not replace a support taxonomy, but they can provide safer, more consistent evidence than screenshots and copied production logs.
Metric 7: Customer Feedback and Effort With Honest Denominators
Customer feedback belongs in the scorecard, but it needs a denominator and context. Report survey response rate next to CSAT or NPS, segment the result by channel and issue type, and preserve written comments for qualitative review. A score based on a small, self-selected group should not be treated as the voice of every developer. Compare feedback with verified resolution, reopens, and recurrence to see whether perception and technical outcomes agree.
Metric 8: Engineering Toil and Durable Improvement
API support often hides inside engineering calendars. Track engineering assist rate, engineer minutes per eligible conversation, interrupt count, context-switching time, and the technical categories consuming that effort. Google SRE recommends objective units such as minutes, hours, completed tickets, or predictable exchanges when measuring toil, and it advises comparing the cost of automation with the time and indirect benefits it can save.
Separate valuable engineering work from repetitive toil. A novel product defect investigation is not the same as repeatedly explaining an undocumented scope or manually reconstructing a request that could carry a safe correlation identifier. Label the reason engineering joined and the durable output: product fix, source repair, diagnostic tool, known limitation, or no change. That makes the backlog legible to product and engineering leaders.
Avoid turning the metric into pressure to reject customers. The goal is to remove repeated, automatable friction while preserving expert involvement where it changes the outcome. A falling engineering assist rate is good only if verified resolution, customer feedback, and recurrence remain healthy. Otherwise the organization may simply have made escalation harder.
Build a Balanced API Support Metrics Scorecard
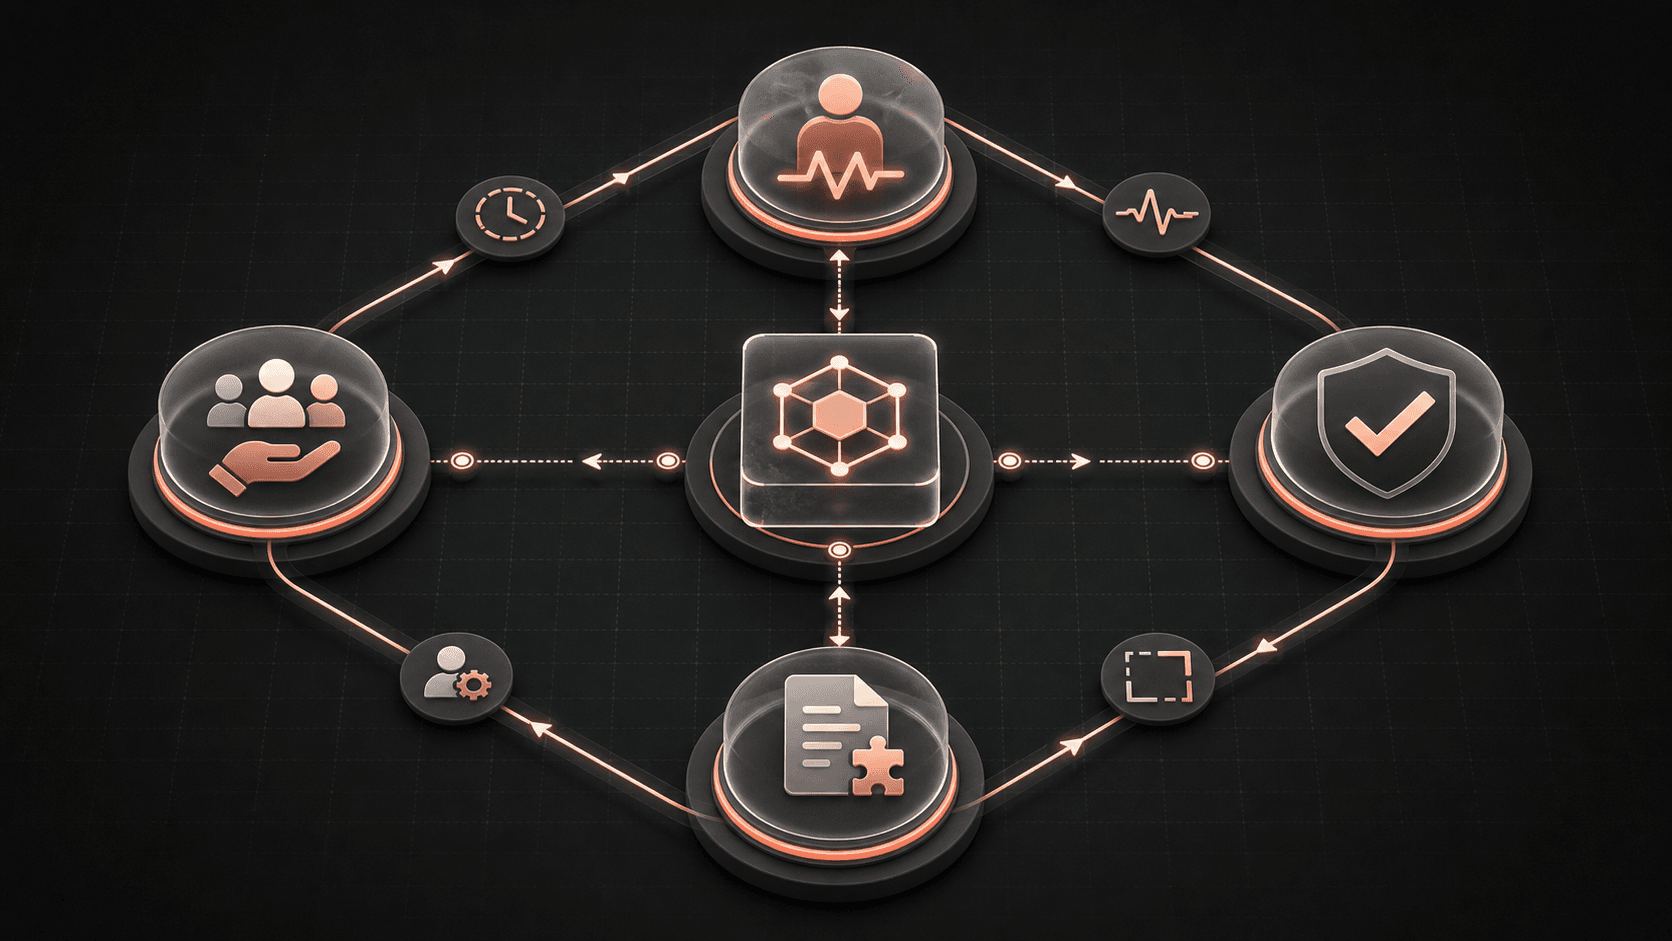
Combine the metrics into four views instead of one synthetic score. The customer view covers first meaningful response, time to verified resolution, reopens, effort proxies, and feedback. The technical quality view covers verification coverage, supported claims, corrections, and unsafe claims. The improvement view covers recurrence, documentation gaps, source repair time, and product defects. The capacity view covers queue latency, handoff latency, engineering toil, and workload by category.
Set a small number of objectives only after observing a baseline. Choose objectives that protect the journey, such as a tail response target for urgent cases, minimum verification coverage for authentication and webhook cases, a handoff acknowledgment target, and a reduction target for one recurring issue category. Add guardrails so an improvement in one dimension cannot hide damage in another.
- Speed objective plus guardrails: first meaningful response p90, with correction and reopen rates held below agreed bounds.
- Resolution objective plus guardrails: time to verified resolution p50 and p90, with verification coverage above the minimum.
- Automation objective plus guardrails: supported answer rate, with unsafe claims, inappropriate answers, and poor handoffs reviewed.
- Improvement objective plus guardrails: recurrence reduction for a named category, with exposure and customer mix controlled.
- Capacity objective plus guardrails: engineering hours removed from repeated work, with customer outcomes stable or improving.
How Woes Supports an API Support KPI Program Today
Woes currently gives workspace operators a shared analytics layer over the same support model used by live chat, email, and Discord. The implemented Analytics surface calculates conversation volume, channel mix, median first response and resolution times, first-, next-, and resolution-SLA adherence, customer and assignee views, macro usage, and CSAT and NPS summaries. The calculations remain workspace-scoped and the authenticated conversation analytics route requires analytics read permission.
Support-agent analytics expose answered and skipped runs, answer rate, average confidence, average latency, provider and skip-reason groupings, per-agent performance, customer feedback, and survey results. These are operational signals, not proof that every answer was correct. The product's support-agent path separately retrieves workspace context, applies context-sufficiency and confidence behavior, produces customer-safe citations, redacts sensitive content, and clarifies or hands off when evidence does not justify an answer.
That boundary matters when using Woes for an API support KPI program. Use the visible timing, SLA, channel, run, feedback, and survey measures as inputs. Add a reviewed quality sample, a stable technical-issue taxonomy, verification evidence rules, recurrence analysis, and engineering-toil data for the broader scorecard described here. Woes can centralize implemented support signals; it should not be represented as automatically proving ROI or technical correctness without those operating practices.
Launch the Scorecard With a 30-Day Baseline
Use the first week to define the metric contracts and audit data quality. Select the conversation population, severity rules, support schedule, technical taxonomy, resolution evidence types, handoff rubric, and privacy policy. Sample recent records to find missing timestamps, inconsistent statuses, duplicate conversations, and categories that cannot be reproduced. Do not set targets from data you do not yet trust.
In week two, calculate the baseline by channel, severity, category, and owner. Report p50 and p90 for meaningful response and verified resolution; demand and recurrence for the top categories; verification coverage and reopens; handoff quality and latency; answer-quality sample results; source gaps; survey response and scores; and engineering minutes. Keep unknown values visible rather than coercing them to zero.
In week three, choose one bottleneck and one improvement hypothesis. Examples include adding a missing OAuth scope example, routing production-impact cases earlier, requiring a sanitized request identifier, repairing an ingestion gap, or adjusting an AI confidence policy after evaluation. Name the expected leading indicator, outcome metric, guardrail, owner, and review date before making the change.
In week four, compare the same cohorts, inspect outliers, and decide whether to keep, revise, or revert the change. Publish a short narrative with the charts: what moved, what did not, what may be confounded, and what the team will do next. A credible monthly review can say that evidence is insufficient. That is better than turning normal variation into a victory story.
- Week 1: define contracts, taxonomy, evidence rules, and privacy boundaries.
- Week 2: baseline distributions, quality, recurrence, gaps, feedback, and toil.
- Week 3: run one bounded improvement with an outcome and guardrails.
- Week 4: review comparable cohorts, outliers, data quality, and the next decision.
Use API Support Metrics to Improve the Next Resolution
The best API support metrics describe a chain of evidence. A developer asked for help. The team responded meaningfully. The technical blocker reached a verified outcome. Automation answered only when context supported it. Human escalation preserved the investigation. The resolution improved documentation or the product when a recurring gap existed. The organization learned how much customer and engineering effort the journey required.
Begin with demand, meaningful response, verified resolution, reopens, and engineering assist time. Add handoff and answer-quality review before optimizing automation. Then connect recurring categories to documentation and product repairs. Keep every definition versioned, every denominator visible, and every target paired with a guardrail.
That scorecard will not compress developer support into one flattering number. It will do something more useful: show which part of the system is creating friction, which intervention is worth testing, and whether the next developer reaches a trustworthy answer with less effort.
Sources and Standards
This Woes article references public standards and developer documentation that shape API support workflows.
Related Woes Pages
Continue into the Woes product pages that connect this topic to API-native support workflows.