Developer Support Automation ROI: A Framework Beyond Deflection
Measure developer-support automation ROI with verified resolutions, full lifecycle costs, quality guardrails, and a counterfactual that finance and support can defend.
Developer Support Automation ROI Starts With Incremental Value
Developer support automation ROI is the incremental, risk-adjusted value created when automation helps developers reach correct outcomes with less customer, operator, and engineering effort, after subtracting the complete cost of delivering and governing that automation. The important word is incremental. A conversation that would have resolved through documentation anyway is not new value merely because a bot appeared in the journey.
That definition is intentionally stricter than ticket deflection. A developer can leave a chat because the answer worked, because the answer looked unsafe, because the flow trapped them, or because they opened an issue somewhere else. Those outcomes look identical in a shallow containment report. They have opposite economic and customer consequences.
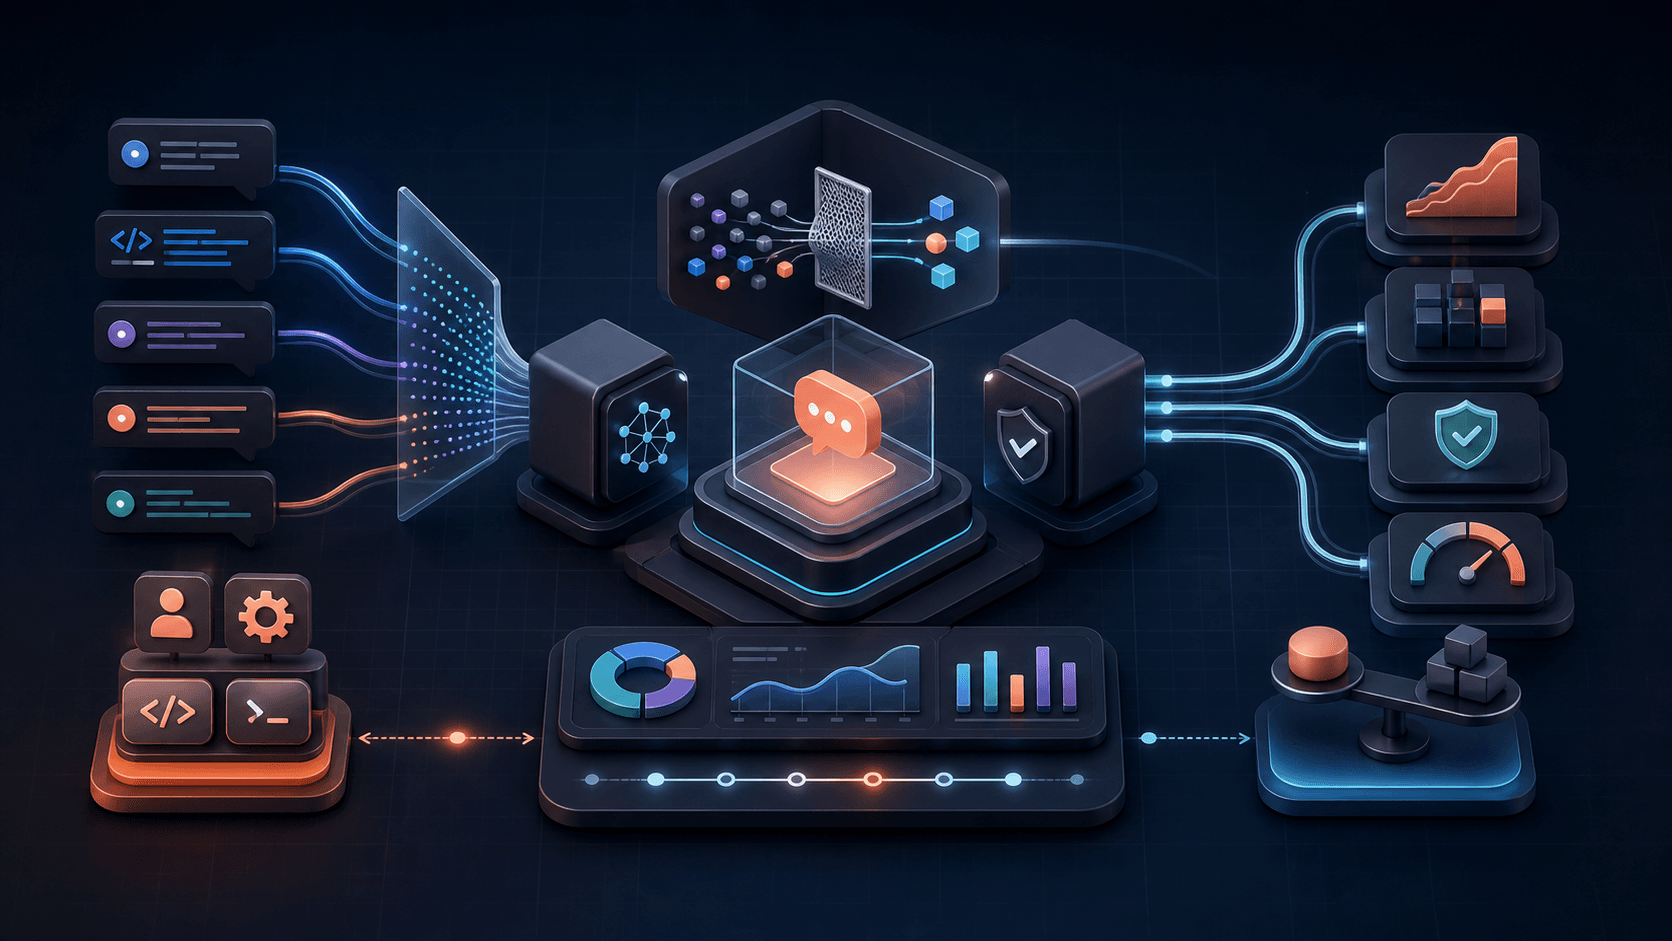
A defensible business case therefore connects four layers: an eligible support demand baseline, a verified customer outcome, the human capacity or risk that actually changed, and every cost needed to operate the system. This framework shows how to build that chain, test the counterfactual, and report a defensible range.
Ticket Deflection Rate Is an Input, Not the Return
Deflection describes requests that self-service appears to keep away from a human queue. Microsoft’s current Copilot Studio guidance notes that organizations define deflection differently and derive it from combinations of resolution, escalation, abandonment, and satisfaction measures. That flexibility is useful operationally, but it also means a deflection percentage is not a portable financial fact.
For technical support, the ambiguity is larger. A customer may receive a correct explanation, copy an invented endpoint, retry the wrong credential, abandon the product, ask the same question by email, or escalate privately to an engineer. Counting all non-escalated sessions as equal rewards the system for making human help hard to reach. Counting every automated answer as a resolution rewards confidence instead of correctness.
Keep deflection as a funnel diagnostic, not the ROI numerator. Reconcile it with verified resolution, recontact, correction, customer feedback, and appropriate handoffs. If automation share and repeat contacts rise together, the system has moved work rather than removed it. Correct handoffs can lower deflection while improving risk and investigation quality.
Define the Decision and Counterfactual Before the Dashboard
Write the decision before choosing the metric. A useful ROI study might decide whether to expand an agent from documentation questions into authentication troubleshooting, whether to renew a platform, whether to automate one repeated issue category, or whether to keep the deployment in assist-only mode. Each decision requires a different eligible population, observation period, cost boundary, and risk tolerance.
Then define business as usual. The counterfactual is what would probably have happened without the intervention: the existing mix of self-service, operator handling, engineering interrupts, unresolved demand, and customer delay. Use a recent period with comparable product releases, customer mix, incident load, channels, and staffing. If seasonality or rapid growth makes a simple before-and-after comparison unreliable, use a matched category, workspace, cohort, phased rollout, or randomized holdout where the customer risk permits it.
Document what could contaminate the comparison. A documentation rewrite, pricing change, major SDK release, outage, staffing change, channel migration, or new customer segment can move support metrics independently of automation. The honest conclusion may be that value is directionally positive but not yet attributable. That is still better evidence than attaching a dollar value to every automated reply.
- Decision: the expansion, renewal, workflow, or operating-mode choice this evidence will change.
- Population: eligible conversations, issue categories, customers, channels, and exclusions.
- Counterfactual: the comparable outcome expected without this automation.
- Window: enough time to observe resolution, recontact, rework, and delayed cost.
- Confounders: releases, incidents, staffing, channel, documentation, and customer-mix changes.
Define a Verified Resolution Before Assigning Value
Create an outcome ladder so a closed session cannot impersonate a solved problem. At the bottom, automation attempted a response. Next, the response was grounded in an eligible source and passed automated policy checks. Above that, the customer acknowledged the answer or the workflow produced an expected technical result. At the top, the issue stayed resolved through a defined recontact window without correction, duplicate contact, or hidden human work.
The evidence should match the issue. Documentation discovery may need a relevant source click plus no repeat contact. A schema question may be verified against the current contract. An authentication case may require a sanitized status or successful test in a safe environment. A product defect should not count as an automated resolution merely because the agent created a clean handoff; instead, value the faster triage and reduced reconstruction work.
Use outcome labels such as verified resolved, customer-confirmed, provisionally contained, appropriately handed off, abandoned, corrected, and unknown. Unknown must remain visible. Assigning unknown sessions to success is one of the easiest ways to manufacture ROI. Report verified-resolution coverage alongside the rate so readers know how much of the population was actually observable.
Value Capacity, Durable Engineering Work, and Customer Outcomes
The first benefit pool is capacity returned. Estimate the operator minutes avoided only for work that disappeared, not work that moved later in the journey. Subtract review, escalation, correction, and follow-up time. When the automation assists a human rather than resolving a request, measure the difference in active handling time for comparable cases and include the time operators spend validating the draft.
The second pool is engineering toil removed. Google SRE describes toil as manual, repetitive, automatable, tactical work that scales with service growth, while engineering work produces a lasting improvement. Repeatedly reconstructing a known request, locating an auth rule, or answering the same SDK setup question may qualify as toil. Investigating a novel production defect is valuable judgment, not waste. Value only the repeated work that automation actually removes and show what engineers did with the returned capacity.
The third pool is customer and product value. Faster verified resolution can shorten integration delay, expose a documentation gap, or prevent an unsafe recommendation. Monetize activation, retention, expansion, or incident effects only when credible analysis connects them to the support change. Otherwise report an operational or risk indicator instead of fictional revenue.
Subtract the Full Lifecycle Cost of Support Automation
Build the cost ledger over the same period and population as the benefits. Include subscription or internal development cost, model and embedding usage, storage, indexing, observability, integration maintenance, evaluation, quality review, security review, support administration, training, change management, vendor management, and the human time spent handling exceptions. Add migration, procurement, incident response, and eventual exit costs when they are material.
Separate fixed, variable, and step costs. Initial implementation and evaluation design are mostly fixed. Model calls, messages, live checks, storage, and some review work vary with usage. Staffing, higher service tiers, or new infrastructure may arrive in steps. That shape matters because a pilot with favorable unit economics can become expensive at a threshold, while a high fixed-cost system may improve as verified volume grows.
Azure’s Well-Architected cost guidance recommends a cost model that includes infrastructure, support, implementation, personnel, training, and change management rather than equating optimization with the lowest bill. Apply the same discipline here. A cheaper agent that increases rework, security exposure, or customer effort is not more efficient. A more expensive system may be rational when it reduces high-severity risk or returns scarce engineering capacity, but the business case must name that trade.
- Fixed: implementation, integration, migration, baseline design, and initial evaluation.
- Variable: model usage, indexing, messages, verification calls, storage, and sampled review.
- Operational: administration, source upkeep, incident handling, retraining, and provider management.
- Risk: expected correction, exposure, downtime, compliance, and recovery cost.
- Exit: export, replacement, retraining, contract termination, and decommissioning.
Calculate Developer Support Automation ROI as a Range
Calculate gross incremental benefit by summing evidenced capacity value, avoided recurring expense, and attributable customer or risk value. Subtract total automation cost to get net benefit. Divide net benefit by total automation cost for ROI, and divide the initial investment by recurring net benefit for a simple payback period. Keep the time basis, currency, labor rates, utilization assumption, and treatment of fixed costs visible.
Do not present one precise number when the inputs are ranges. Create conservative, expected, and optimistic scenarios. The conservative case can use only verified resolutions, realized labor changes, and observed costs. The expected case can include strongly supported capacity reuse. The optimistic case may include broader customer value, clearly labeled as uncertain. HM Treasury’s 2026 Green Book is written for public appraisal, but its general disciplines are useful here: include lifecycle costs and risks, correct for optimism bias, and test how sensitive the decision is to key assumptions.
Publish the switching values. Ask how low verified resolution could fall, how high review cost could rise, or how little handling time could be saved before the investment no longer clears the decision threshold. A business case is stronger when leaders know what would falsify it.
Instrument the ROI Evidence Chain at Conversation Grain
Instrument the chain at conversation grain before aggregating it. Give each eligible interaction a stable privacy-safe identifier, source channel, issue category, automation mode, agent or workflow version, outcome evidence level, human-touch minutes, engineering-touch minutes, recontact link, feedback, and cost allocation. Preserve timestamps for arrival, meaningful response, handoff, first resolution, final resolution, and observation-window completion.
Keep business metrics low-cardinality and governed. OpenTelemetry warns that high-cardinality attributes such as user identifiers or raw paths can create unbounded cost and distort filtered queries after overflow. Store investigation context in access-controlled records or traces; aggregate by bounded dimensions such as category, channel, automation mode, severity, source set, or version.
Join the support record to product or finance data through approved, minimized identifiers rather than copying customer secrets, message bodies, or credentials into a warehouse metric. The purpose of the join is to test a named outcome, not to create an unrestricted customer dossier.
Segment by Issue Type and Protect High-Risk Work
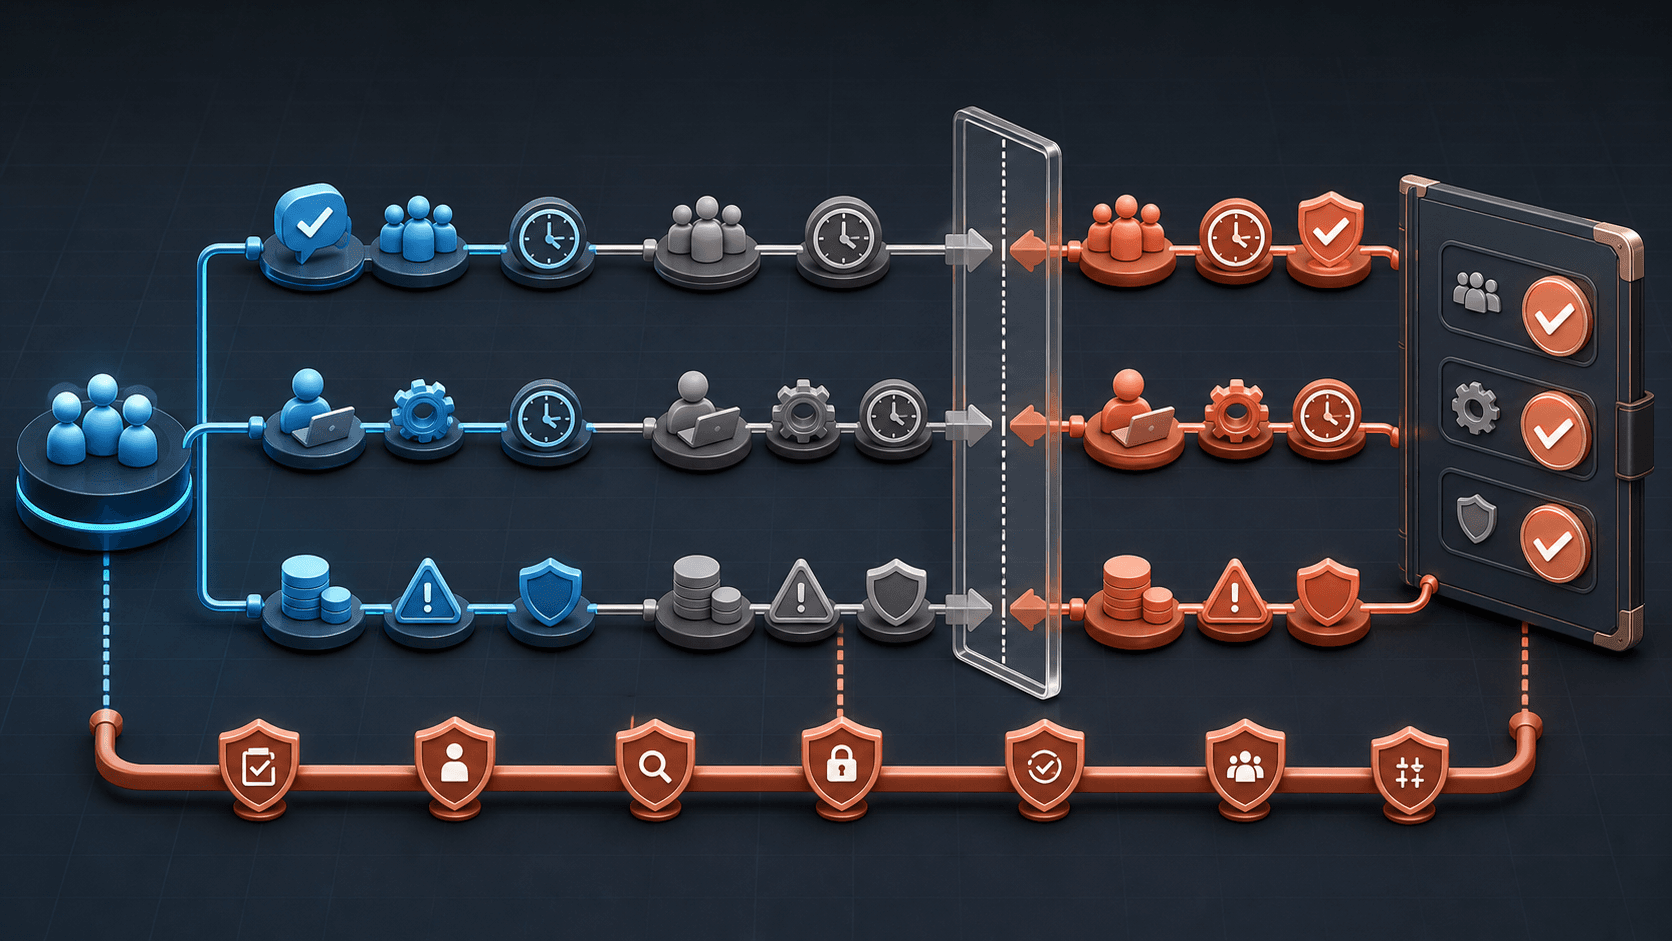
Run the comparison by issue category and risk tier. Start with repeated, well-documented, low-ambiguity work where the expected answer and escalation boundary are observable. Keep authentication, destructive actions, security incidents, billing authority, account-specific decisions, and unclear production failures behind stricter evidence and human controls. One blended automation rate can hide excellent performance on documentation discovery and unacceptable performance on credential troubleshooting.
Use the same versioned evaluation set before and during rollout. NIST’s AI Risk Management Framework treats evaluation and ongoing risk management as part of trustworthy AI operation, not a launch-only ceremony. Review supported claims, citation relevance, context sufficiency, sensitive-data handling, prompt injection, clarification quality, handoff appropriateness, and provider-failure behavior. Sample common questions and the rare cases with the largest downside.
Set expansion gates in advance. A category can graduate from assist-only to customer-facing automation only when verified resolution and evidence quality clear their thresholds, unsafe claims and corrections stay below their limits, and human handoffs remain reachable. The right operating mode can differ by category even when one agent serves the same inbox.
Prevent Metric Gaming With Paired Guardrails
Pair every value metric with a customer, quality, and workload guardrail. Capacity saved belongs beside final resolution, recontact, correction, customer feedback, and tail latency. Automation share belongs beside appropriate handoff and abandonment. Model cost belongs beside evidence quality. First response belongs beside time to verified outcome. No single guardrail proves success, but the set makes common shortcuts visible.
Zendesk’s current metric catalog distinguishes first reply, first resolution, full resolution, requester wait, agent wait, and business-hours variants. That separation illustrates why a support journey cannot be reduced to one timer. Use comparable created and resolved cohorts, show the denominator, report medians and tails, and keep unresolved cases in view. A fast median can coexist with a damaging long tail.
Review qualitative evidence too. Read a stratified sample of transcripts, corrections, survey comments, and handoffs. Ask whether the developer knew what happened next, whether sources actually supported the answer, whether a human received the investigation context, and whether automation removed effort or merely concealed it.
- Value: verified resolutions and net human minutes returned.
- Customer: recontact, full resolution, wait, feedback, and abandonment.
- Quality: supported claims, corrections, unsafe actions, and citation relevance.
- Routing: appropriate clarification and handoff, plus time to human ownership.
- Operations: latency, availability, source freshness, cost, and review workload.
How Woes Contributes Evidence Without Inventing ROI
Woes currently provides several inputs for this framework, all scoped to the authenticated workspace. Conversation analytics uses the shared live chat, email, and Discord conversation model and exposes bounded conversation data for channel, status, customer, response, resolution, and SLA analysis. The Analytics surface derives median first-response and resolution times, channel and queue views, and first-, next-, and resolution-SLA adherence.
Support-agent runs record answered versus skipped outcomes, confidence, latency, token usage, estimated cost, skip reasons, complexity, and named-agent identity. Workspace analytics can combine those runs with customer thumbs feedback and CSAT or NPS survey responses. The support-agent execution path separately uses workspace-scoped retrieval, context-sufficiency and confidence behavior, customer-safe citations, redaction, clarification, and human handoff rather than treating every request as answerable.
Those implemented signals do not automatically calculate developer support automation ROI. Woes does not by itself prove that an answered run was a verified resolution, detect every cross-channel recontact, assign a finance-approved labor value, construct a causal counterfactual, or monetize activation and retention. Export or join the appropriate scoped data, add review evidence and finance assumptions, and keep those additional calculations explicit. Woes can centralize the support evidence layer; the organization still owns the economic claim.
Build a 90-Day Developer Support Automation Business Case
Use the first 30 days to define the decision, eligible population, issue taxonomy, outcome ladder, privacy boundary, cost ledger, and guardrails. Audit recent conversations for missing timestamps, duplicated contacts, inconsistent statuses, hidden engineering work, and resolution claims without evidence. Build conservative ranges before changing automation behavior.
During days 31 through 60, run a bounded comparison on one or two repeated categories. Keep a comparable holdout or phased baseline when safe. Review every high-risk output and a stratified sample of routine outcomes. Reconcile automated attempts with final resolution, recontact, corrections, handoffs, human minutes, and observed run cost. Fix source and workflow gaps before widening the audience.
During days 61 through 90, calculate conservative, expected, and optimistic cases; run sensitivity analysis; and document confounders. Decide separately for each category whether to stop, remain assist-only, expand customer-facing automation, or collect more evidence. Publish the assumptions, switching values, quality results, and operating changes alongside the financial range.
- Days 1–30: define, baseline, audit data quality, and price the full cost boundary.
- Days 31–60: compare a bounded cohort and review outcomes at conversation grain.
- Days 61–90: calculate ranges, test sensitivity, and make category-level decisions.
Prove Value With Outcomes, Costs, and an Honest Counterfactual
A credible developer support automation ROI story does not begin with how many tickets a bot touched. It begins with a specific support decision and a counterfactual. It counts only outcomes the evidence can support, values capacity that was actually returned, subtracts the full lifecycle cost, and refuses to hide customer effort or risk inside an attractive deflection rate.
Start with one repeated issue category. Define verified resolution and the recontact window. Measure operator and engineering touch time. Record model, platform, review, maintenance, and risk costs. Compare a credible baseline, pair the value measure with quality and customer guardrails, and publish a range with switching values.
The result may be smaller than a vendor calculator, but leaders can interrogate it and operators can improve it. The objective is not maximum containment. It is more correct outcomes with less avoidable effort and no concealed transfer of cost or risk.
Sources and Standards
This Woes article references public standards and developer documentation that shape API support workflows.
Related Woes Pages
Continue into the Woes product pages that connect this topic to API-native support workflows.